Building A Better Serial Plotter
Introduction
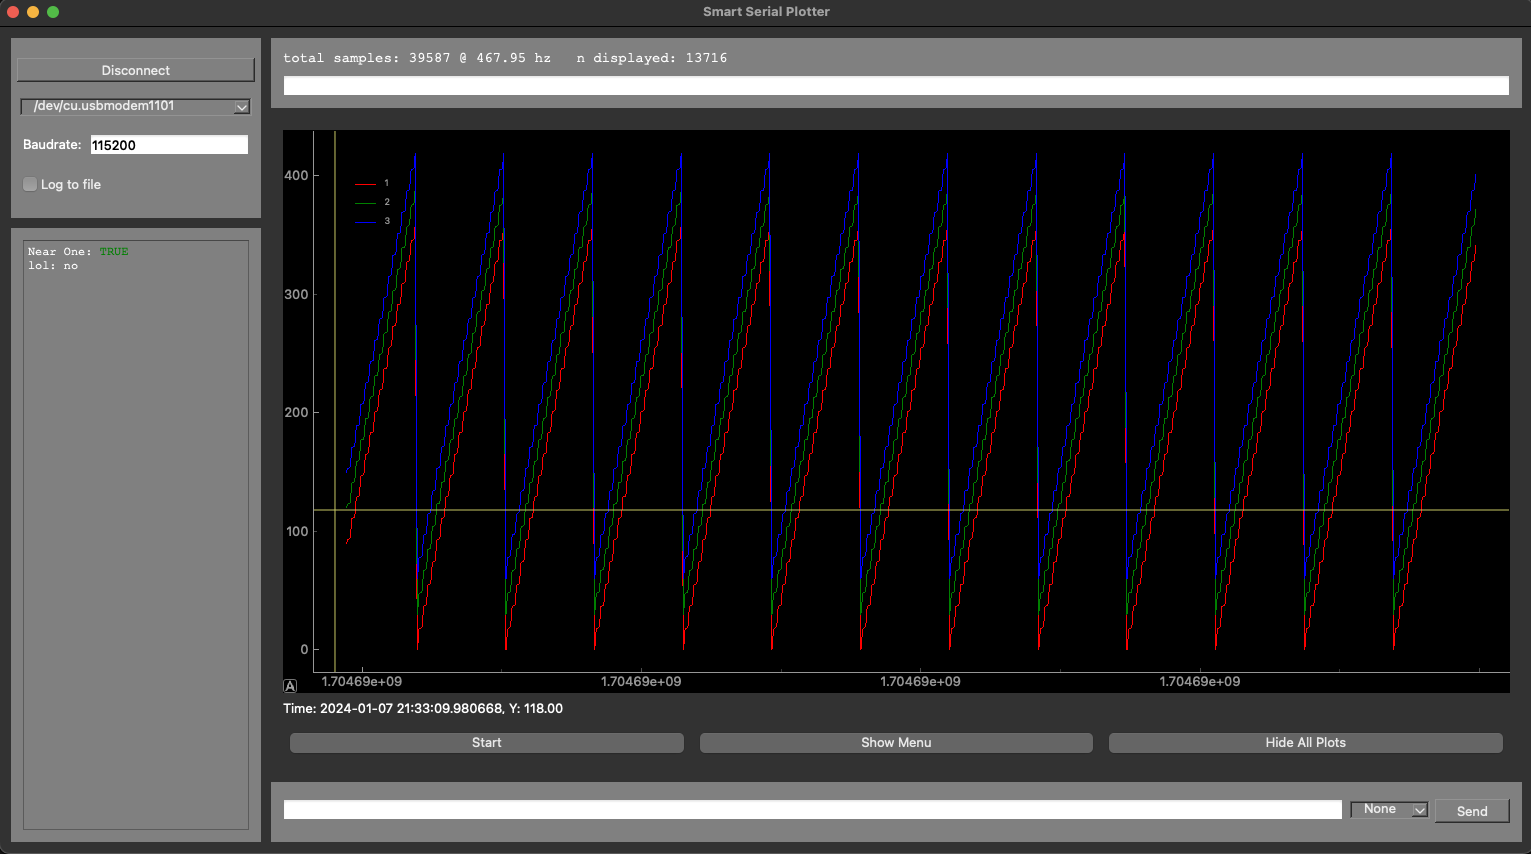 behold…
click here for the GITHUB LINK
In developing new revisions of my motordriver board for our exoskeleton project, I found the need to use a serial plotter. I needed to plot several different trendlines on a live plotter and examine them. Furthermore, and perhaps most importantly, I needed to calculate information about this data after it reached the computer.
Sounds very abstract, lemme give you an exact example.
I needed (and still do need to) plot the ADC readings converted to a voltage across my shunt resistors live and, preferably, get a sense of the RMS noise of the data coming out of the ADC.
Serial plotters are needed to do real development work. The existing practice of dumping serial data from a txt file into a csv file and then into an excel document to me seems archaic. Fuck excel.
Plotters let you watch the effect of changes to your DUT (Device Under Test) live while playing with them. This is invaluable for tracking down bugs too. Being able to watch the noise level creep up as I bring my phone closer to the onboard ADC while on a cellular call is just one example of the unexpected learnings when you have a full live view of what exactly is going on.
So I built my own. All the code is completely open source and meant to be easily understood and easily modifyable.
A full user-guide will be in a different blog post. What follows is some background, discussion of the previous state of the art, and some technical notes.
Background
For those who don’t know, or aren’t familiar, a serial plotter is exactly what it sounds like - it plots numerical serial data. The only real common solution that I could find was the plotter built into the Arduino IDE.  GIF courtsey of Arduino
This is great for examining the pure shape of your plots and very basic measurements, but it’s utterly useless for everything else. It’s sort of a black-box. You don’t have any timestamping at all, so you don’t know when things happened. There’s also no present method of increasing/decreasing the points displayed per window. If you want to examine your past-data in a longer-term plot, or even log your recieved data, you’re SOL.
Moreover, there are hundreds of exisitng solutions. Many of them are built to different specifications and varying levels of complexity.  I love hackaday…
The solutions with built-out UI’s seemed complicated to modify, if it was possible to do so at all. The simple solutions were all purpose-built and many of them had runtime issues that had run stale after months or years of neglect.
Frequently in development of this project, and even many others in my past, I really wish I had a simple, performant, and modify-able serial plotter. Here’s exactly what I outlined.
Design Requirements
- Timestamps: I need my datapoints to be sync’d to the MCU’s local time, whether that be in uS, mS, or S.
- UI/UX:
- Easily switch ports
- Toggle different trendlines
- Switch between a live scrolling feed and a historical snapshot
- A cursor
- TX raw serial data from the UI
- Zoom/Scroll
- See the datarate and other key elements of the data recieved
- Report system statuses from the MCU, fault conditions, etc.
- Logging: I need to be able to log the data in a way to be able to be read back by a python script or a way that can be replayed at a later time
- Performant: When reading a serial message, the program cannot stop plotting data nor vice-versa, because any stuttering in the rendering would be confusing and may give the false impression that the MCU is delayed or operating incorrectly.
- Custom Analyses: Perhaps most importantly, I need to be able to specify custom mathematical analyses to be done on the data being displayed. Whether that be a point->point operation, trendline->point, trendline->trendline, trendline(s)->trendline(s) etc. Imagine being able to define a custom class using numpy that accepts a single trendline’s data and then calculate the mean and display that mean. Or, in another case, a class that accepts a single trendline’s data and then plots the RMS noise of the last n points on top of the live data itself.
Rather than wrestle with existing implementation, I set out to spin up a serial plotter entirely made by me.
Development Journey
The first thing I did was try to get a proof of concept using matplotlib. Safe to say, this would severly limit my expansion ability. No easy way of integrating buttons, autoscaling, text-inputs, or statuses being printed.

While we’re at it, it’s also safe to say that Python’s sort of a necessary evil here. What we gain in ease of development and some more robust exception handling (espicially when passing data through multiple threads), we definetely lose in speed.
Technical Deep-Dive
Conceptually, there are three different categories of tasks that our plotter needs to handle.
- RX/TX messages with accurate timestamping and logging
- Plotting this data rapidly on a live-updating plot
- Provide a UI/UX for the user to intreact with the plotter.
The most technically interesting and novel part of this project is how the serial interfacing is built out. Let’s discuss that.
RX/TX (src/messsage_classes.py, src/serial_class.py)
All the serial handling is done in this class. The main crux of it is as follows
- Instantiate the class, which itself creates several threadsafe data strucutres
- The client starts the ‘start’ function, which starts a loop to continually send/recieve messages and update the appropriate data strucutres.
- The ‘end’ function stops this infinite loop and safely closes the serial connection
At any time between the ‘start’ and ‘end’ function, the client is guaranteed that any messages pushed to the TX queue will be sent to the device, and all messages wil be put into the RX queue.
The config dictionarty is somewhat arbitrary, as there are other configuration parameters that we need to supply the infinte loop. For example, the baudrate or the port address.

Part of the brilliance of these classes is the time synchronization.
Due to the fact that this thread may be started in the middle of the device sending a serial message, we may recieve garbled messages. In the most degenerate case, the rate of data sent over from the MCU will match closesly with the rate at which we read the data, and we wil continually recieve erroneous half-messages.
We therefore try to continually flush the serial interface, counting each failed attempt, and wait until we successfully latch several correct messages in a row. In many cases, the degenerate case will not occur. However, we often read the first message incorrectly, and thus we need to handle that exception while also raising an exception if too many messages have been read incorrectly.
Upon the time of our first latched message, the system takes note of it’s system time in nS, as well as the reported time of the message from the MCU. We now can offset every message recieved from the MCU relative to our system time, knowing that we have a point in time in which they were synchronized.
This means that we can be 100% confident that, regardless of thread-availabiity or any buffer issues with the serial monitor, the true time of a message on the MCU will be accurately represented in the plot.
Future Directions
- Custom-analyses being integrated first in the paused-historical view, and then in realtime in the live-feed mode.
- Logged data replaying
- General bug tracking (Please submit bugs to github!)